SpaceView Logo

SpaceView

Developed by RSC

Learn More!

Heat Maps

The Heat Maps module provides users with a broad view of employee density where their organization owns real estate across the entire world. The feature uses either Google or Here maps to display an interactive map view with various markers signifying different population densities.

Heat Maps

Legend

Users will see a legend signifying the meaning of the different colors and symbols on the heat map:

Heat Map Legend
  • Red dot = 1,000 or more headcount
  • Yellow dot = 65 - 1,000 headcount
  • Green dot = 1 - 65 headcount
  • Blue dot = greater than or equal to 1 headcount

The legend is collapsible so users can hide or expand it as needed.

Location Details

Specific location details are available for each heat marker. To access these location details, users may click on either a city in the locations list or the heat map marker. A box will appear next to the heat map marker with such as:

  • Theater
  • City
  • Number of buildings
  • Number of employees
  • Building list

Other Buttons in Heat Maps

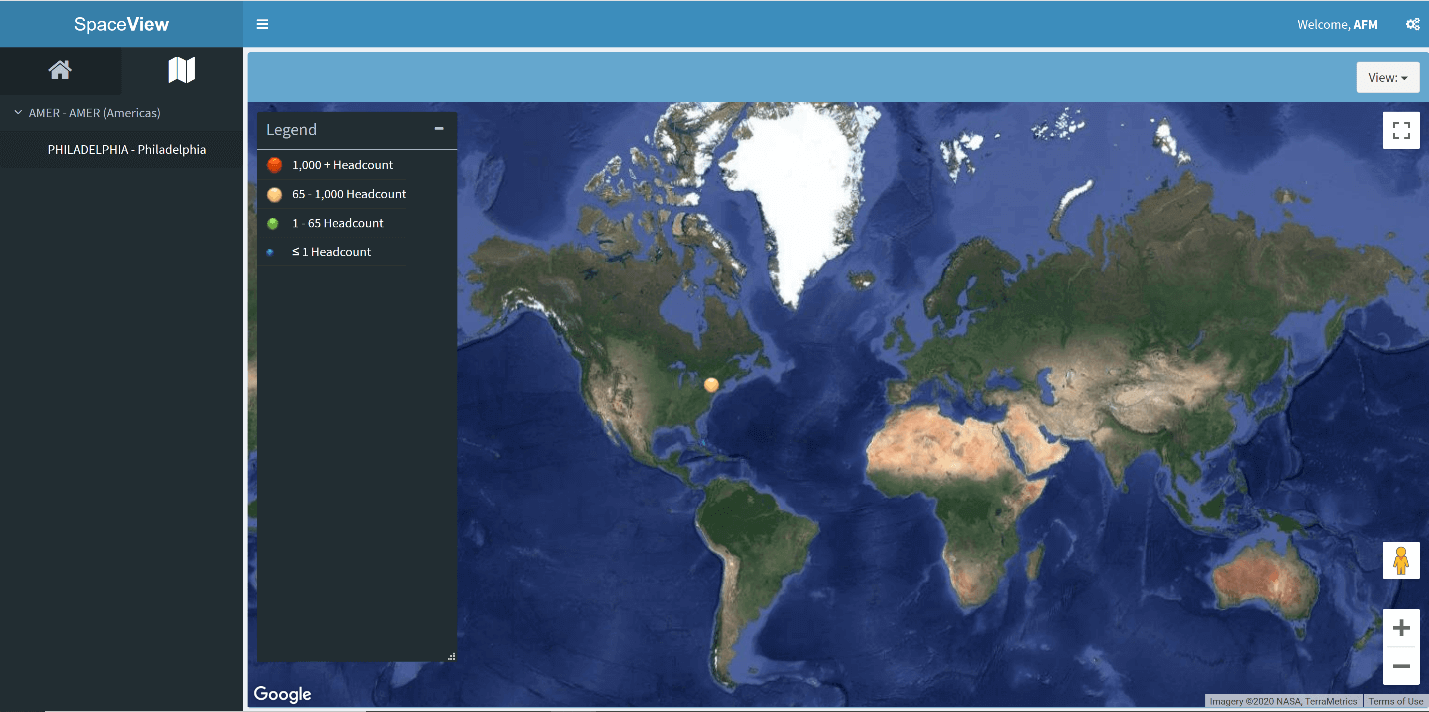
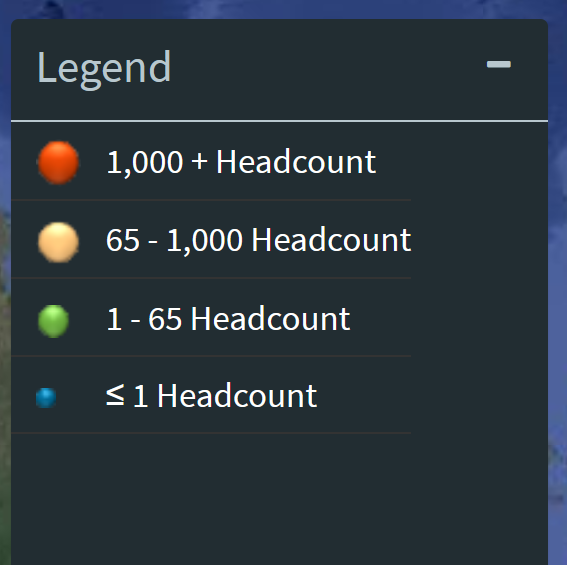
Users will find map navigation buttons on the right-hand side of the screen in Heat Maps.
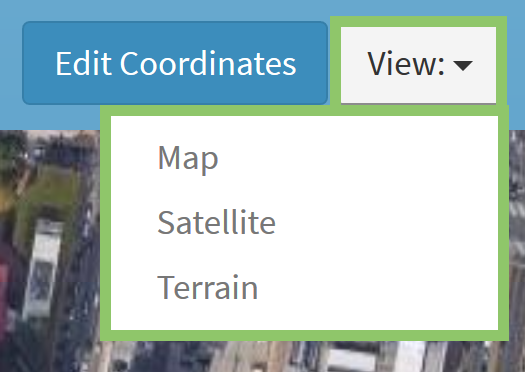
Other Buttons in Heat Maps

View

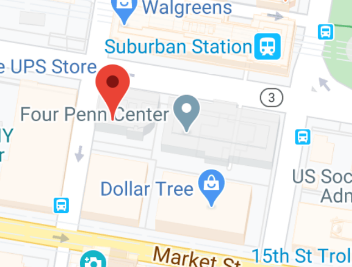
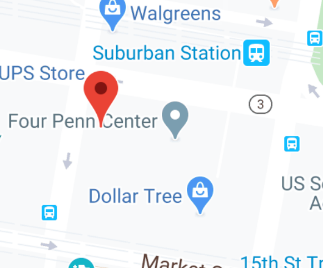
The "View" pull-down menu lets users change the type of map they are seeing. Users have three options: Map, Satellite, and Terrain.
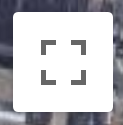
View Map Type
Screenshot
Screenshot 2
Screenshot 3

Full Screen

The full-screen toggle button allows users to move in and out of full-screen view.

Full Screen

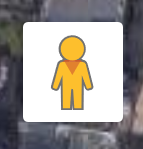
Walk in Google Street View

The button that looks like a person is a drag-and-drop button that, when dropped anywhere on a map, allows users to "walk" within the street view.
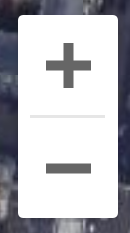
Walk in the Google Street View

Zoom

The plus and minus buttons allow users to zoom in and out. Users can also use the scroll on their mouse to zoom.

Zoom